
How to Calculate Repeat Purchase Rate for a Small D2C Brand
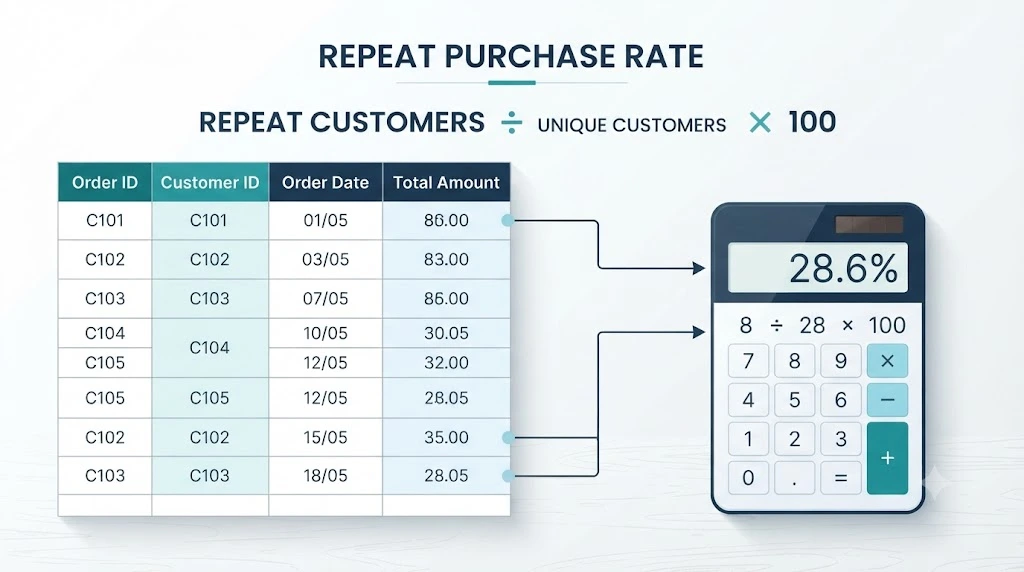
You can have a store that looks great, ads that bring in traffic, and still have no idea whether anyone comes back. That blind spot is expensive. Repeat purchase rate closes it.
It tells you what share of your customers placed more than one order in a period you choose. Put differently, it answers a plain question: of the people who bought from us, how many bought again?
This guide shows how to calculate repeat purchase rate step by step, starting with the formula. The tricky part is getting the inputs right: which customers count, which orders to leave out, and which dates to use. If you’re also working on keeping buyers around, our guide to customer retention strategies for small D2C brands covers the tactics. This article stays focused on the maths.
The short answer:
Repeat purchase rate measures the percentage of customers who placed more than one order during a defined period. To calculate it, divide the number of customers who purchased more than once by the total number of unique purchasing customers in that period, then multiply by 100.
One rule matters more than any other: the top and bottom of that fraction must use the same period and count unique customers, not orders.
What Is Repeat Purchase Rate?
Repeat purchase rate is the percentage of your buyers who ordered at least twice within a set window. It’s a customer count, not an order count.
A shopper who orders three times in the window is still one repeat customer. That small detail trips up a lot of first-time calculations.
Repeat Purchase Rate vs. Repeat Customer Rate
You’ll see both terms used, often for the same thing. Many guides treat “repeat customer rate” and “repeat purchase rate” as close cousins, and some tools label the same idea differently.
What matters is that you write down your definition and keep it fixed. If your team calls it “repeat customer rate” but calculates it the way this article does, that’s fine. Just don’t switch definitions halfway through a quarter.
Why the Measurement Period Matters
A rate without a window is half a number. “25%” could mean 25% over 30 days, 90 days, or the whole life of the store, and those are very different stories.
Pick the window first. Then use it for every comparison you make.
Repeat Purchase Rate Formula
Here is the formula in one line:
Repeat purchase rate = (Customers with 2 or more qualifying orders ÷ Unique purchasing customers) × 100
Both numbers come from the same date range. That’s the whole formula. The rest of this section is about what goes into it.
The Basic Formula
Take your chosen period. Count every unique customer who placed at least one qualifying order. That’s your denominator.
From that group, count the customers who placed two or more qualifying orders. That’s your numerator. Divide, then multiply by 100.
What Counts as a Repeat Customer?
A repeat customer is a person with two or more qualifying orders inside your measurement window. “Person” is the key word. You identify them by a unique customer ID, such as an email address or a customer record, not by order number.
Decide your rules early and write them down:
- Do guest checkouts with the same email count as one customer?
- Does a customer who ordered once last year and once this month count, or only orders inside the window?
- What about someone who used two different emails?
There’s no single rule that fits every business. What’s useful is consistency.
Before calculating the rate, standardize customer IDs so the same buyer isn’t counted twice because of different email addresses or duplicate customer records.
Which Orders Should You Exclude?
Most brands exclude a couple of kinds of orders before counting:
- Test orders placed by your team while setting up the store
- Cancelled orders that never shipped
Refunds and returns are a policy call. Some brands count an order as qualifying once it’s paid. Others remove fully refunded orders. Either approach can be reasonable. Choose one, document it, and apply it to every period you compare.
How to Calculate Repeat Purchase Rate Step by Step
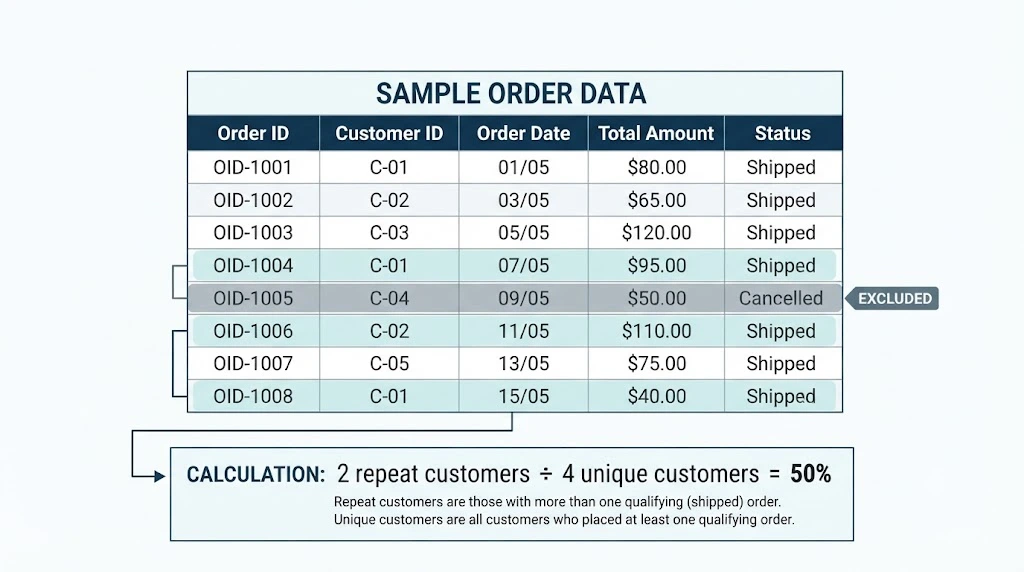
Let’s walk through it with a tiny order list. Small enough to check by eye, which is the point.
| Order ID | Customer ID | Order Date | Order Status |
|---|---|---|---|
| ORD-1001 | C-01 | 03 Jul | Completed |
| ORD-1002 | C-02 | 05 Jul | Completed |
| ORD-1003 | C-01 | 19 Jul | Completed |
| ORD-1004 | C-03 | 21 Jul | Completed |
| ORD-1005 | C-04 | 28 Jul | Cancelled |
| ORD-1006 | C-05 | 02 Aug | Completed |
| ORD-1007 | C-02 | 11 Aug | Completed |
| ORD-1008 | C-01 | 30 Aug | Completed |
This is a made-up sample for learning purposes, not data from a real store.
Step 1: Choose a Measurement Period
Say we’re measuring July 1 to August 31. Every order we count must fall inside that window.
Practical tip: pick a window that matches how often your product gets reordered. A coffee brand and a furniture brand shouldn’t use the same one.
Step 2: Count Unique Purchasing Customers
Our rule for this example: cancelled orders don’t qualify. That removes ORD-1005, so C-04 has no qualifying order and drops out.
The unique purchasing customers are C-01, C-02, C-03 and C-05. That’s 4.
Step 3: Identify Customers With Two or More Orders
C-01 has three qualifying orders. C-02 has two. C-03 and C-05 have one each.
So 2 customers are repeat customers: C-01 and C-02.
Step 4: Apply the Formula
2 ÷ 4 × 100 = 50%
Step 5: Check the Result Against Your Order Data
Run a quick sanity check. Do the repeat customers you counted really have two or more qualifying orders? Does the denominator exclude the cancelled order?
If your number looks oddly high or low, the culprit is almost always an inclusion rule, such as test orders left in or a mismatched date range.
Repeat Purchase Rate Calculation Example
Now a larger, round-number scenario to see the percentage at brand scale.
A Worked Example for a Small D2C Brand
This is an illustrative example built to explain the method. It isn’t performance data from any real brand. All customers are counted inside one measurement window.
| Metric | Example |
|---|---|
| Unique customers in the selected period | 800 |
| Customers with 2+ qualifying orders | 200 |
| Repeat purchase rate | 25% |
How to Calculate the Percentage
200 ÷ 800 × 100 = 25%
In plain words: one in four customers who bought in that window bought at least twice.
Common Mistakes That Change the Result
On the 8-order sample, the repeat purchase rate is 50% because 2 of the 4 unique purchasing customers placed multiple orders. A different metric, the share of completed orders that came after a customer’s first order, would be 3 ÷ 7, or about 42.9%. These figures answer different questions, so don’t use the second calculation as a substitute for repeat purchase rate. The full checklist of slips to avoid is in the mistakes section near the end.
How to Calculate Repeat Purchase Rate in Excel or Google Sheets
A spreadsheet is enough for most small brands. You just need a clean export and three helper columns.
Prepare Your Order Data
Export orders for your chosen period. Keep one row per order and these columns:
| Order ID | Customer ID | Order Date | Order Status |
|---|
The counting policy used here: an order qualifies only when its status is Completed and its order date falls inside your chosen period. Cancelled, test, pending and refunded orders are excluded under this spreadsheet’s default policy. If your store uses different status labels, or you want a different refund policy, update the status criteria in the formulas and apply the same rule to every period you compare.
Choosing the period: the sheet has no date selector. Filter your export to the period first (for example July 1 to August 31), then paste only those rows. Keep a note of the dates next to your result.
A warning that saves a lot of confusion: don’t count customer rows directly. Each order is its own row, so a customer with three orders appears three times. Counting rows counts orders, and your result will be wrong.
Identify Unique Customers With Multiple Orders
Assume your data starts in row 2, with Customer ID in column B and Order Status in column D. Add three helper columns and fill them down only to your last data row. The sample below ends at row 9.
- E2 (qualifying orders for this customer):
=IF(OR(B2="",D2<>"Completed"),0,COUNTIFS($B$2:$B$9,B2,$D$2:$D$9,"Completed")) - F2 (marks each customer’s first qualifying row, so they’re counted once):
=IF(OR(B2="",D2<>"Completed"),0,IF(COUNTIFS($B$2:B2,B2,$D$2:D2,"Completed")=1,1,0)) - G2 (marks a unique customer with 2+ qualifying orders):
=IF(AND(F2=1,E2>=2),1,0)
Change $9 to match your last row. Blank customer IDs and non-Completed orders are ignored. These formulas work the same way in Excel and Google Sheets. For background on the functions, see Microsoft’s page on Excel’s COUNTIF function.
Calculate the Final Percentage
Now two cells do the work:
- Unique customers:
=SUM(F2:F9) - Repeat customers:
=SUM(G2:G9) - Repeat purchase rate:
=IF(SUM(F2:F9)=0,"No customers",SUM(G2:G9)/SUM(F2:F9))(format the cell as a percentage). If no customers qualify, it shows a message instead of an error.
On our 8-order sample, the cancelled order is ignored and the result is 50%.
Validate the Spreadsheet Results
Do a second check before you trust the number. In Google Sheets, =COUNTUNIQUE(FILTER(B2:B9,D2:D9="Completed",B2:B9<>"")) should match your unique-customer total (4 on the sample). Google documents the function on its COUNTUNIQUE help page.
This check validates the unique-customer total only. To validate the repeat purchase rate, also confirm that each customer flagged as a repeat buyer has at least two qualifying Completed orders in the filtered data.
Then scan a few customers by hand. Pick one repeat customer and one single-order customer and confirm their flags are right.
Free Repeat Purchase Rate Calculator
Calculate your repeat purchase rate without manually counting customers or orders. Download this free Excel calculator to organize your order data, identify repeat customers, and calculate your repeat purchase rate using a consistent measurement period.
What’s included:
- Order data template with customer IDs, order dates, and order status
- Automatic calculation of unique and repeat customers
- Repeat purchase rate dashboard
- Sample data and step-by-step instructions
Download the Free Repeat Purchase Rate Calculator
Note: The calculator counts orders marked “Completed” by default. Use data from your chosen measurement period and apply your order-exclusion rules consistently.
How to Calculate Repeat Purchase Rate in Shopify
Shopify gives you good raw material. It just doesn’t hand you this exact metric in one click, so you’ll combine its reports with your own calculation.
Find the Relevant Customer and Order Data
In your Shopify admin, go to Analytics > Reports, then filter by the Customers category. According to Shopify’s Help Center, the Customers reports include New vs returning customers, Returning customers, One-time customers and a Customer cohort analysis.
For your own calculation, an order export with customer email and order date gives you the cleanest starting point.
Check How Shopify Defines Returning Customers
Read the definitions before comparing numbers. In the New vs returning customers report, Shopify describes a first-time customer as someone placing their first order. A returning customer is someone placing an order when their history already includes at least one earlier order.
Notice what that means. Shopify classifies a customer at the moment of each order. That’s a slightly different lens from “customers with 2+ orders in my chosen window.”
Calculate Your Own Repeat Purchase Rate
Use the method from the earlier sections:
- Export orders for your chosen period.
- Remove excluded orders under your policy.
- Count unique customers.
- Count customers with two or more qualifying orders.
- Divide and multiply by 100.
Then use Shopify’s reports as a cross-check, not as the source of truth for this metric.
Why Shopify Reports May Show a Different Number
Your figure and a Shopify report can differ, depending on each one’s definition, date window and counting rules. They can also match. Compare the rules before you compare the numbers.
Shopify’s documentation says customer reports are based on a customer’s entire order history, not only orders in the selected dates. In its example, a new customer in November still appears as a repeat customer if the second purchase happens in December.
Your window-based calculation can’t see that December order, so the two figures answer slightly different questions. Before comparing any two repeat-buying numbers, check whether each counts people, orders, or people at the moment of an order.
How to Measure Repeat Purchase Rate Over 30, 60, or 90 Days
Fixed windows make results easier to compare. The trick is keeping the rules identical every time.
Choosing a Measurement Window
Shorter windows (30 days) suit fast-moving products that people reorder quickly. Longer ones (90 days) leave room for slower repurchase cycles.
Think about how long your product lasts. A 30-day skincare serum and a pair of boots shouldn’t share a window.
Calculating a 90-Day Second-Purchase Rate for a Customer Cohort
This is a different metric from the overall repeat purchase rate above. The overall rate uses everyone who bought in a period. The cohort version uses only customers whose first order fell in a chosen month, and asks whether each placed a second order within 90 days of their own first order date. The 90 days are counted from each customer’s first order, so a second order in April still counts for a customer whose first order was on January 28. They aren’t limited to purchases inside the calendar month.
90-day second-purchase rate = (Cohort customers with a second order within 90 days of their first ÷ Customers in the cohort) × 100
Here’s an illustrative example:
| Metric | Example |
|---|---|
| Customers whose first order fell in January | 400 |
| Of those, customers who ordered again within 90 days | 72 |
| 90-day second-purchase rate for the January cohort | 18% |
Calculation: 72 ÷ 400 × 100 = 18%. This is a teaching example, not real brand data. Don’t put this figure next to an overall repeat purchase rate. They have different denominators.
Comparing Different Customer Groups Fairly
A 30-, 60- and 90-day figure only means something when the groups, eligibility rules and counting rules match. Compare only cohorts that have completed the full window. Customers who haven’t had their 90 days yet will make a recent cohort look weaker than it is.
Repeat Purchase Rate by Customer Cohort
A single blended rate hides a lot. Cohorts let you see how different groups of buyers behave.
What Is a Customer Cohort?
A cohort is a group of customers who share a starting point, most often the month of their first purchase. Everyone who bought for the first time in March is the “March cohort.”
This is different from a plain repeat purchase rate. The basic rate is one snapshot across everyone. A cohort view follows each group over time.
How to Group Customers by First Purchase Month
In a spreadsheet, add a column with each customer’s first order date, then convert it to a month. Group customers by that month.
Shopify does this for you in its Customer cohort analysis report, which groups customers into cohorts by the date of their first order by default, according to the same Help Center page.
How to Compare Repeat Purchases Across Cohorts
Line up cohorts by “time since first order,” not by calendar date. That means comparing the March cohort’s first 90 days with the April cohort’s first 90 days.
Look for patterns. Did customers acquired through a launch offer reorder less often? Did a new packaging insert lift your most recent cohort? Cohorts won’t prove the cause, but they point you toward the right questions.
Repeat Purchase Rate vs. Customer Retention Rate
These two metrics get mixed up often. They’re related, but they measure different things.
What Each Metric Measures
Repeat purchase rate looks at buyers in a period and asks how many ordered more than once.
Customer retention rate looks at customers you had at the start of a period and asks how many you still have at the end. A common formula is (customers at end − new customers acquired) ÷ customers at start × 100.
Which Metric Should a Small D2C Brand Use?
If you sell products people reorder, start with repeat purchase rate. It’s easy to calculate from order data and ties directly to buying behaviour.
Retention rate fits better when you care about the size of your active base over time, or when you run subscriptions.
When to Track Both Metrics
Track both once you have a few months of clean data. Together they show whether customers return (repeat rate) and whether your active base holds up (retention rate).
How to Interpret Your Repeat Purchase Rate
A number on its own tells you very little. What you compare it to is what gives it meaning.
Compare Your Own Results Over Time
Your best benchmark is your own history. Calculate the rate the same way every month or quarter, then watch the trend.
If the rate rises while your customer acquisition cost (CAC) stays flat, you’re getting more value from each customer you pay to acquire. That pairing is worth tracking.
Compare Similar Products and Customer Cohorts
Split the rate by product category, first-purchase product, or acquisition channel. A skincare refill and a one-off gift set will behave very differently, so blending them hides the story.
Why There Is No Single Ideal Rate for Every D2C Brand
You’ll find benchmark figures all over the internet. Treat them carefully. Product category, repurchase cycle, price point and the observation period all change what a “good” result looks like.
A brand selling consumables will naturally see more reorders than one selling furniture. Use outside numbers only as loose context, and trust your own trend line more.
Common Repeat Purchase Rate Calculation Mistakes
Use this as your final checklist before trusting a number.
Counting Orders Instead of Customers
Three orders from one buyer is one repeat customer. Count unique customer IDs.
Mixing Different Measurement Periods
The numerator and denominator must cover the same dates.
Counting Cancelled or Test Orders Inconsistently
Set one exclusion policy and apply it to every period you compare.
Confusing Returning Customer Rate With Repeat Purchase Rate
Platforms may use similar labels for different calculations. Check the definition first.
Comparing Incomplete Cohorts With Mature Cohorts
A cohort that hasn’t finished its window will look weaker than one that has.
Your Next Step
You don’t need new software to get started. Export last quarter’s orders, set your exclusion rules, and calculate your repeat purchase rate this week.
Write down the window, the rules and the result. Next month, run the same steps. Within a few cycles you’ll have a trend, and that trend will tell you more than any industry average.
Ready to try it? Pull one clean order export today, work through the five steps above, and save the result with its definition in a simple sheet you can reopen next month.
Frequently Asked Questions
How do you calculate repeat purchase rate?
Divide customers with two or more qualifying orders by unique purchasing customers in the same period, then multiply by 100. See the step-by-step section for a full example.
What is the repeat purchase rate formula?
(Customers with 2+ orders ÷ Unique purchasing customers) × 100, using one measurement window for both numbers.
How do you calculate repeat purchase rate in Excel?
Add helper columns that count orders per customer, flag each customer once, and flag unique customers with 2+ orders. Then divide the two totals. The formulas are in the spreadsheet section.
How do you calculate repeat purchase rate in Shopify?
Export orders with customer details, apply your exclusion rules, and calculate it yourself. Use Shopify’s customer reports as a cross-check, keeping in mind that they follow their own definitions.
What is the difference between repeat purchase rate and retention rate?
Repeat purchase rate shows how many buyers in a period ordered more than once. Retention rate shows how many customers you kept from the start of a period to its end.
How do you calculate 90-day repeat purchase rate?
Take a cohort by first-order month, count who placed a second order within 90 days, and divide by the cohort size. This is a cohort metric, not the same as the overall rate.
What is a good repeat purchase rate for a D2C brand?
It depends on your product, price, repurchase cycle and window, so there’s no single target. Compare your own results over time and across similar cohorts.
Sources referenced in this article