
Ecommerce Conversion Rate by Industry: 2026 Benchmarks for Small Stores
Your store converts at 1.5%. Is that good?
It depends on who you ask. One report says yes. Another says you’re behind. Both can be right, because they measure different stores, in different countries, in different ways.
Ecommerce conversion rate by industry helps small online stores understand how their sales performance compares with relevant benchmarks. But there is no single average that fits every store. Conversion rates vary by product category, country, traffic mix, and measurement method. This guide compares September 2026 industry data, explains its limitations, and shows how to choose a useful benchmark for your store.
That’s why looking up a single “average” doesn’t help much. A useful comparison needs the right industry, a relevant group of stores, and the same way of counting. This guide compares published ecommerce conversion rates by industry, explains why benchmarks differ, and shows how to use one source carefully. The main dataset is an IRP Commerce merchant panel, not a national average or a small-store-only sample.

What Is the Ecommerce Conversion Rate?
Conversion rate tells you how often a visit ends in a purchase. It sounds simple. The tricky part is what you count as a “visit”.
How to Calculate Purchase Conversion Rate
Use this formula:
Conversion rate = completed purchases (orders) ÷ sessions × 100
Here’s a worked example. Say your store had 2,000 sessions last month and 40 orders. That’s 40 ÷ 2,000 × 100 = 2.0%.
Before you compare that number with anything, check how the benchmark source calculates it. IRP Commerce, the source used in this guide, defines it as transactions divided by sessions, multiplied by 100. That’s a session conversion rate.
Why Sessions and Users Can Produce Different Rates
A session is one visit. A user is one person who may visit several times.
Picture one shopper who visits your store three times and buys on the third visit. Counted by session, that’s 1 purchase in 3 sessions. Counted by the user, it’s 1 purchase from 1 person. Same shopper, very different percentage.
Some sources count sessions. Others count visitors. If you compare your session-based rate with a user-based benchmark, the gap you see may come from the method, not your store.
Ecommerce Conversion Rate by Industry in 2026
Here is what one transparent source reports. IRP Commerce publishes monthly benchmark data calculated from trading data on its own platform. Its Market Data Centre covers B2C ecommerce in Great Britain, Northern Ireland and Ireland, and IRP says its main interest is independent SME and mid-market merchants.
One thing to be clear about: this is a reference point for comparison, not a small-store-only benchmark. IRP doesn’t publish a breakdown by store size, so you can’t isolate small stores from the rest of the panel.
Industry Benchmark Table
| Industry | Conversion rate | Reporting period | Source |
|---|---|---|---|
| Arts and Crafts | 5.76% | September 2026 | IRP Commerce |
| Health and Wellbeing | 2.83% | September 2026 | IRP Commerce |
| Kitchen & Home Appliances | 2.59% | September 2026 | IRP Commerce |
| Pet Care | 2.13% | September 2026 | IRP Commerce |
| Sports and Recreation | 1.90% | September 2026 | IRP Commerce |
| Cars and Motorcycling | 1.76% | September 2026 | IRP Commerce |
| Fashion Clothing & Accessories | 1.62% | September 2026 | IRP Commerce |
| Food & Drink | 1.28% | September 2026 | IRP Commerce |
| Toys, Games & Collectables | 1.07% | September 2026 | IRP Commerce |
| Baby & Child | 0.44% | September 2026 | IRP Commerce |
| All markets combined | 1.97% | September 2026 | IRP Commerce |
Data checked in October 2026. Conversion rate is transactions ÷ sessions × 100. The panel covers B2C stores in Great Britain, Northern Ireland and Ireland. It is not a national average.
Benchmarks vary by country and measurement method. Before comparing your store with these figures, check the original source, the reporting period and the geographic coverage. The published benchmark figures are on the IRP Commerce Market Data page.
What the Source Figures Show
The spread is wide. Arts and Crafts sits at 5.76%, while Baby & Child sits at 0.44%. IRP’s combined figure across the listed ecommerce sectors is 1.97%.
That doesn’t mean Arts and Crafts stores are “better run”. Different products create different buying behaviour. A £9 craft supply and a high-priced nursery item don’t ask the same thing of a shopper.
In the same IRP table, Baby & Child also shows the highest average order value, at £871.49. So a low rate can sit next to big orders. Conversion rate alone doesn’t tell you what a session is worth.
How to Read the Source and Reporting Period
Three details matter before you copy any number into a report.
- The panel. These are stores on IRP’s platform, in Great Britain, Northern Ireland and Ireland. That’s a defined group, not every store in those countries.
- The period. The table shows one month. One month can swing, as you’ll see below.
- The sample size. The page doesn’t show how many stores sit behind each sector, so treat small sectors with extra care.
Why E-commerce Conversion Benchmarks Differ
If you’ve searched for a conversion rate benchmark by industry before, you’ve probably seen numbers that don’t match. Here’s why.
Different Store Samples and Platforms
Every dataset comes from somewhere. One may lean toward large retailers. Another may come from stores on a single platform. Another may skew toward one country.
A group of mostly new, low-traffic stores will usually look different from a group of established brands. Neither group is wrong. They’re just different groups.
Session-Based vs User-Based Conversion
We covered this above, but it’s worth repeating. Sessions and users give different percentages for the same store. When two reports disagree, check this first.
Average vs Median
An average can be pulled up by a few very strong stores. A median shows the middle store.
Here’s a real example. Shogun’s current 2026 YTD benchmark report covers 803 active Shopify stores, updated through September 2026. It reports a 2.54% mean and a 1.74% median, a difference of 0.80 percentage points. Read the method and industry breakdown in Shogun’s 2026 YTD benchmark report.
Reporting Period and Seasonal Change
Conversion rates move month to month and year to year. Holidays, sales and traffic mix all play a part.
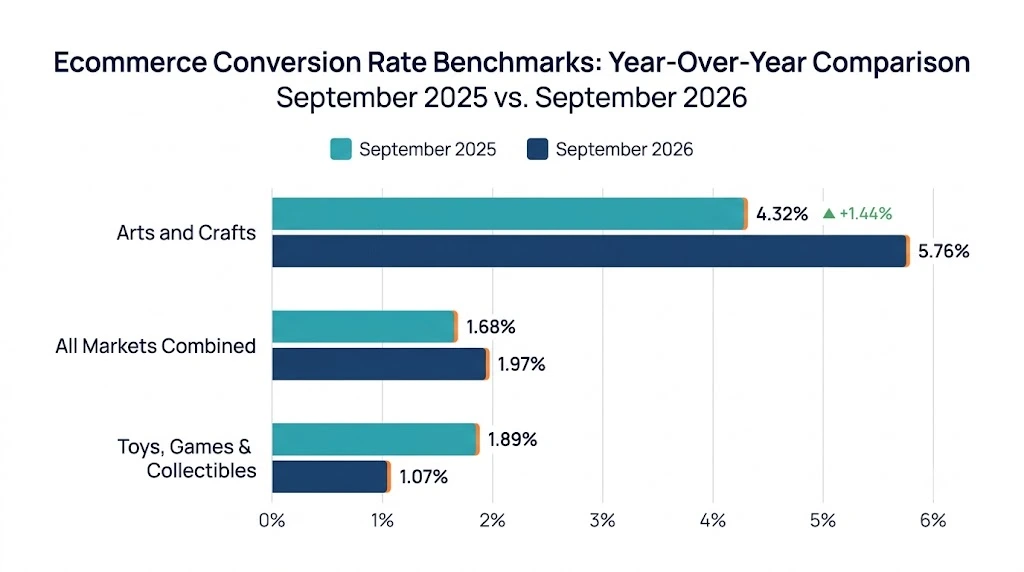
Real data example from IRP Commerce: the same source shows how much one sector can change in a single year.
| Sector | September 2025 | September 2026 | Change |
|---|---|---|---|
| Toys, Games & Collectables | 1.89% | 1.07% | Down 0.82 percentage points |
| Arts and Crafts | 4.32% | 5.76% | — (source discrepancy) |
| All markets combined | 1.68% | 1.97% | Up 0.29 percentage points |
*Source: IRP Commerce Market Data, September 2026 versus September 2025. IRP’s main comparison table reports +1.43 percentage points, while its detailed Arts and Crafts page reports +1.44 percentage points for the same displayed rates (4.32% and 5.76%). The source pages conflict on the difference, so verify the current page before quoting the year-on-year change. See IRP’s detailed Arts and Crafts data.
Toys fell. Arts and crafts rose. The overall figure rose too. One month isn’t a full year, so use a monthly benchmark as a reference point, not a target.
Which Industry Benchmark Should a Small Store Use?
Pick the benchmark that looks most like your store. Use five checks.
- Product category. Choose the sector closest to what you sell. If you sell across two, compare against both.
- Country coverage. A benchmark covering Great Britain, Northern Ireland and Ireland may be a useful reference for those markets, but it represents IRP’s own merchant panel rather than every store in the region.
- Platform and sample. Ask who is in the group. Small independent stores and global brands behave differently.
- Conversion definition. Match sessions with sessions, or users with users.
- Reporting period. Compare against a period that fits yours. A holiday month isn’t a fair match for a quiet one.
If no source passes all five checks, say so in your report. An honest “closest available” beats a number that looks exact but isn’t.
How to Compare Your Store With an Industry Benchmark
Let’s walk through it with a hypothetical example. This is not a real store.
Say a small UK fashion store had a session conversion rate of 1.45% in September 2026. It picks the IRP Fashion Clothing & Accessories figure for the same month as its benchmark.
| Item | Value |
|---|---|
| Store conversion rate (hypothetical) | 1.45% |
| Selected benchmark (IRP, September 2026) | 1.62% |
| Gap | 0.17 percentage points below |
Notice the wording: percentage points, not percent. The gap between 1.45% and 1.62% is 0.17 percentage points.
Now the important part. That gap is a comparison. It isn’t proof that something is broken. The store might have a different traffic mix, a smaller sample of sessions, or a quiet week. Treat the gap as a question worth asking, not an answer.
What These Benchmarks Can and Can’t Tell You
Benchmarks are useful. They also have limits.
Sample limits. Published datasets come from specific groups of stores. Small independent shops are often under-represented in them.
Geographic coverage. The IRP table covers Great Britain, Northern Ireland and Ireland. It doesn’t describe India, the US or any other market. If you sell elsewhere, look for a source that covers your market, and check its method before you trust it.
Small-store differences. A store with a few hundred sessions a month can see its rate jump around from small changes. A benchmark built on larger volumes won’t move that way.
Profit and performance. A benchmark can’t tell you whether your store is profitable. For that, you need your own data on costs, traffic and orders. If you want to see how to reduce customer acquisition cost for D2C brands, our D2C guide covers the link between the two.
The cause of a gap. A benchmark shows that a gap exists. It doesn’t say why. Payment problems are one thing worth ruling out, and this ecommerce payment gateway audit checklist is a relevant place to start.
Frequently Asked Questions
What is a good ecommerce conversion rate in 2026?
It depends on your category, country and how the rate is counted. In IRP Commerce’s September 2026 panel data, the combined figure across listed sectors was 1.97%, and sector figures ranged from 0.44% to 5.76%. These are panel results, not national averages. A useful comparison is one that matches your category, geographic market and measurement method.
Does ecommerce conversion rate vary by industry?
Yes. In IRP’s September 2026 table, Arts and Crafts converted at 5.76% while Baby & Child converted at 0.44%. Product type, price and how people shop all play a part.
Should I compare my store with a global or country-specific benchmark?
Start with the one closest to where your customers live. If most of your customers are in Great Britain, Northern Ireland or Ireland, the IRP panel may be a useful reference, but it represents IRP’s merchant panel rather than the full national market. If not, find a source that covers your market and read its method first. Always label which one you used.
Why is my conversion rate different from published benchmarks?
The usual causes are a different sample, a different definition (sessions vs users), a different reporting period, or a different traffic mix. Check those four before assuming your store has a problem.
Final Thoughts
Ecommerce conversion rate by industry is a useful reference, as long as you treat it as one. There’s no single average that fits every store. The fair comparison is the one with a similar category, a similar country, the same counting method and a matching time period.
Your next step: open the IRP Commerce Market Data page, find the sector closest to yours, and write down three things: the definition, the reporting period and the coverage. Then compare your own rate and note the gap in percentage points. That one page of notes will tell you more than any headline average.