
Ecommerce Inventory Forecasting: How Small Stores Can Build and Validate Demand Forecasts

Your sales history is sitting in your store dashboard. Next month’s sales are not. Closing that gap is what ecommerce inventory forecasting is about: turning past orders into a reasonable estimate of future demand.
You don’t need a data science team to do it. You need clean data, a simple baseline, and the habit of checking your forecast against what actually sold.
This guide covers the demand-prediction side of inventory planning: estimating how many units you’ll sell, then checking how close you got. You’ll build a forecast from historical sales, compare it with an AI prediction, and measure which one lands closer. Choosing a tool is a separate decision, and our guide to inventory management software for small retail stores covers that.
Prepare Sales Data for E-commerce Inventory Forecasting
A forecast is only as good as the records behind it. Spend your first hour here, not on fancy models.
Collect Historical Sales by Product and Date
Pull sales at the product level, with a date on every row. That’s the minimum.
Then pick a rhythm: daily or weekly. Daily data shows more detail but jumps around a lot. Weekly data smooths the noise, which makes it a practical starting point for lower-volume stores.
Shopify sales reports can show sales over time and by product. Its Inventory sold daily by product report provides average daily units sold by product variant over a selected period, but it isn’t a complete day-by-day sales history. Its quantity sold metric also excludes returns, manual adjustments and transfer receipts. Check each export’s definitions and time granularity before using it to build a forecast. You may need to combine suitable data sources to create a consistent product-by-date dataset.
How much history do you need? Shopify’s demand forecasting guidance treats about eight weeks of consistent weekly orders as a starting point for general demand planning. That’s not a guarantee that eight weeks will give a reliable forecast for every product. After a year of orders, you can begin accounting for seasonal patterns in your forecasts. The amount of history available still affects how reliably you can estimate those patterns.
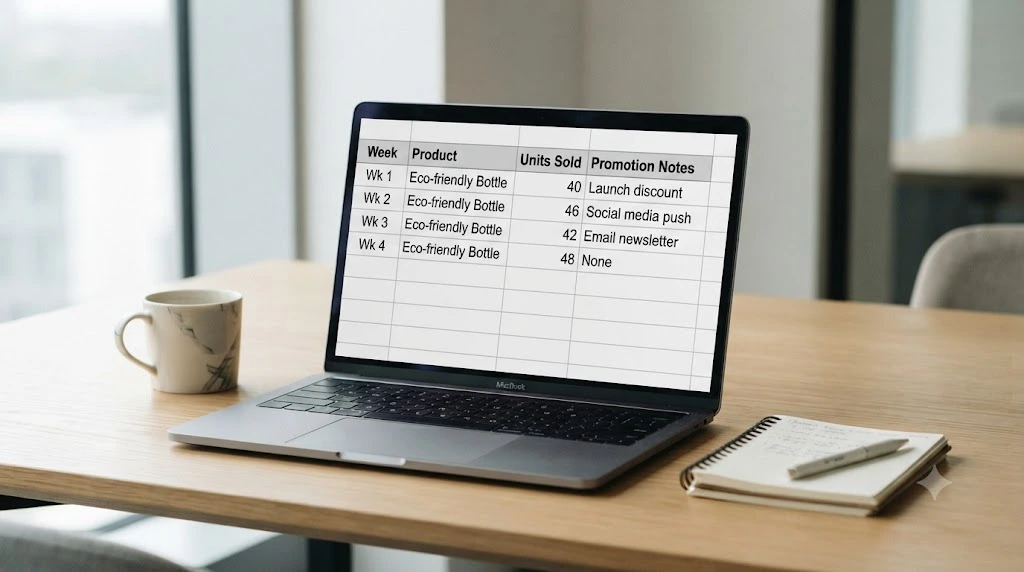
Keep SKU and Product Variants Consistent
A blue medium and a blue large are separate product variants, often with their own SKUs. Keep their sales separate.
Check that each variant has one name and one identifier across all your records. If a product was renamed halfway through the year, the history can split in two, and your forecast will think demand fell off a cliff.
If identifiers are a mess, fixing them first is worth the time. Our walkthrough on how to set up barcode inventory for a retail store shows one way to do it.
Flag Promotions, Launches and Unusual Sales Periods
Mark every sale, campaign, launch and seasonal event in a separate column. A week with a 30% discount isn’t a normal week, and your forecast shouldn’t treat it as one.
Decide what you’re actually forecasting: units ordered, units shipped, or net units sold after returns. Pick one, then treat cancellations and returns the same way every week. Some reports record adjustments such as returns on the day they were processed, not the day of the original order, so check how your report handles them.
Mark any out-of-stock days as well. We’ll come back to why they matter.
Choose the Right Forecasting Period and Level
Before you forecast anything, decide two things: how often and for what.
Daily or Weekly Forecasts: Which Fits Your Sales Pattern?
If a product sells a handful of units a week, daily numbers will be mostly zeros and ones. Go weekly. If you sell hundreds of units a day, daily data can show patterns, like a weekend bump, that weekly totals hide.
Forecast Individual Products or Product Groups?
Forecasting every SKU sounds thorough, but sparse items produce shaky numbers. Grouping similar products can give steadier results, but only when their demand patterns are genuinely comparable. A winter coat and a phone case don’t belong in the same group.
A good rule for a newer store: start simple. Pick your top few sellers, forecast weekly, and add complexity only when the basics work. Let your sales volume and the amount of history you have set the level, not the other way round.
Build a Simple Baseline Before Using AI
A baseline is your yardstick. Any fancier forecast has to beat it, or it hasn’t earned its place.
Start With a Previous-Period Baseline
The easiest forecast there is: next week will look like last week. If you sold 48 units last week, your baseline says 48.
It’s crude, and that’s the point. It costs nothing, and it gives you a number to beat.
Use a Moving Average to Estimate Near-Term Demand
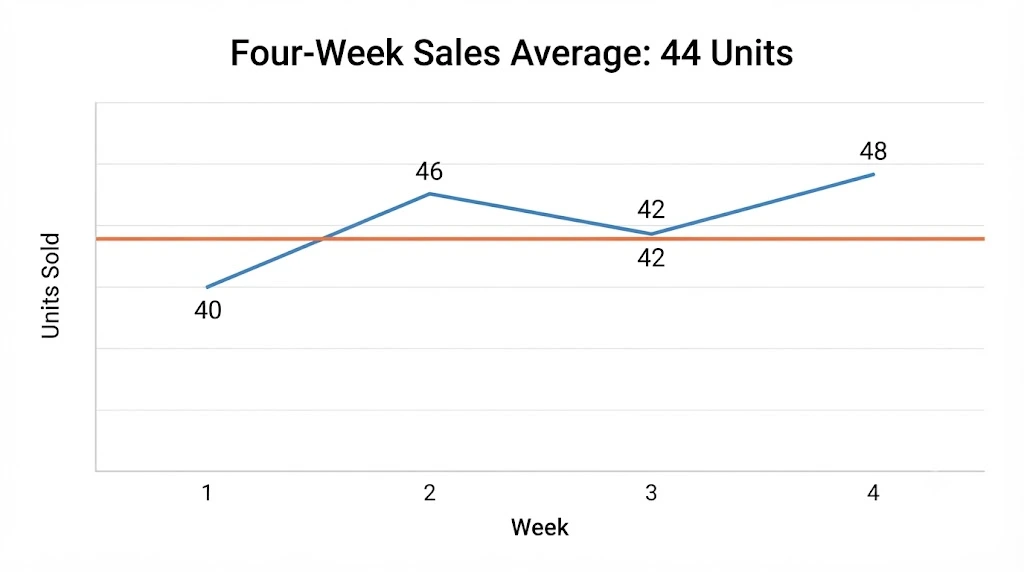
A moving average smooths out the ups and downs. Say your last four weeks looked like this: 40, 46, 42 and 48 units.
Add them up (176) and divide by four. Your baseline is 44 units.
That’s a starting estimate, not a promise about next week.
Understand What a Simple Forecast Can and Cannot Capture
A baseline handles steady demand fairly well. It struggles with promotions, launches, holidays and sudden trends, because it only looks backward at plain averages.
Knowing where it falls short tells you when it’s worth testing something smarter.
When Does AI Add Value to Ecommerce Inventory Forecasting?
AI isn’t a magic upgrade. It’s another method, and it needs to prove itself on your data.
Recognise Patterns: a Simple Baseline May Miss
When your sales history carries several signals at once, such as price changes, ad spend and weekday effects, a machine learning model may pick up combinations a plain average can’t, provided those signals are in the data you give it and the model is built to use them.
Account for Seasonality and Promotion Effects
Shopify’s order forecasting guidance says a good demand estimate should take promotions, product launches and discontinuations into account. A simple baseline won’t automatically account for an upcoming promotion or product launch. A forecasting model may use those signals if they’re available and the model is designed to incorporate them, but its predictions still need to be tested against actual sales.
Know When a Simple Forecast Is Still Enough
A more complex model is not automatically a more accurate one. If your demand is steady and your catalogue is small, a moving average may do the job well enough.
So the question isn’t “Which tool is smartest?” It’s “Does this prediction beat my baseline on sales it hasn’t seen?” The next section shows how to answer that.
How to Validate Ecommerce Demand Forecast Accuracy
Validating forecast accuracy is an important step before relying on a prediction for business decisions.
Test Predictions Against Sales Data the Model Has Not Seen
A model can look brilliant on the history it learned from. That tells you very little.
Hold back the most recent few weeks. Build your forecast using only the older data, then compare it with what really sold in the held-back weeks. This idea of a separate test period is explained well in the forecast accuracy chapter of Forecasting: Principles and Practice.
Calculate Mean Absolute Error (MAE)
MAE is the easiest accuracy measure to read. For each week, calculate the absolute difference between actual sales and forecast sales, regardless of whether the forecast was too high or too low. Then average those absolute errors across the test weeks.
The answer is in units. An MAE of 5 means you were off by about five units a week, on average.
When Weighted Absolute Percentage Error (WAPE) Is Useful
MAE is in units, so it’s hard to compare across products with very different volumes. WAPE expresses the error as a percentage instead. You add up all the absolute errors, then divide by the total actual sales.
It has limits. When you pool many products into one WAPE figure, high-volume products carry the most weight, so check per-product results too. And if total actual sales in the test period are zero, WAPE can’t be calculated.
The AWS documentation on weighted absolute percentage error (WAPE) gives the formula and notes that a lower value means a more accurate model.
Compare AI with the Same Simple Baseline
Run both forecasts on the same test weeks and score them with the same measure. If the AI forecast doesn’t beat the baseline by a margin that matters to you, stick with the baseline.
Worked Example: Compare a Baseline With an AI Forecast
Here’s how the test looks in practice. These numbers are illustrative, not real results.
You use the 44-unit baseline from earlier and hold it flat across four test weeks. The AI forecast numbers below are made up to show the arithmetic, and they’re deliberately mixed: the AI forecast misses by more in one week.
| Week | Actual sales | Baseline forecast | Baseline error | AI forecast | AI error |
|---|---|---|---|---|---|
| 1 | 52 | 44 | 8 | 48 | 4 |
| 2 | 47 | 44 | 3 | 53 | 6 |
| 3 | 58 | 44 | 14 | 51 | 7 |
| 4 | 50 | 44 | 6 | 45 | 5 |
| Total | 207 | 31 | 22 |
MAE. Baseline: 31 ÷ 4 = 7.75 units. AI: 22 ÷ 4 = 5.5 units.
WAPE. Baseline: 31 ÷ 207 ≈ 15.0%. AI: 22 ÷ 207 ≈ 10.6%.
Look at week 2: the baseline was closer there. Judge the methods on the total error across the whole test period, not on any single week. On these made-up numbers, the AI forecast ends with the lower total. This example only teaches the calculation. It isn’t evidence of how AI forecasts perform in real stores, and with real data the result could easily go the other way.
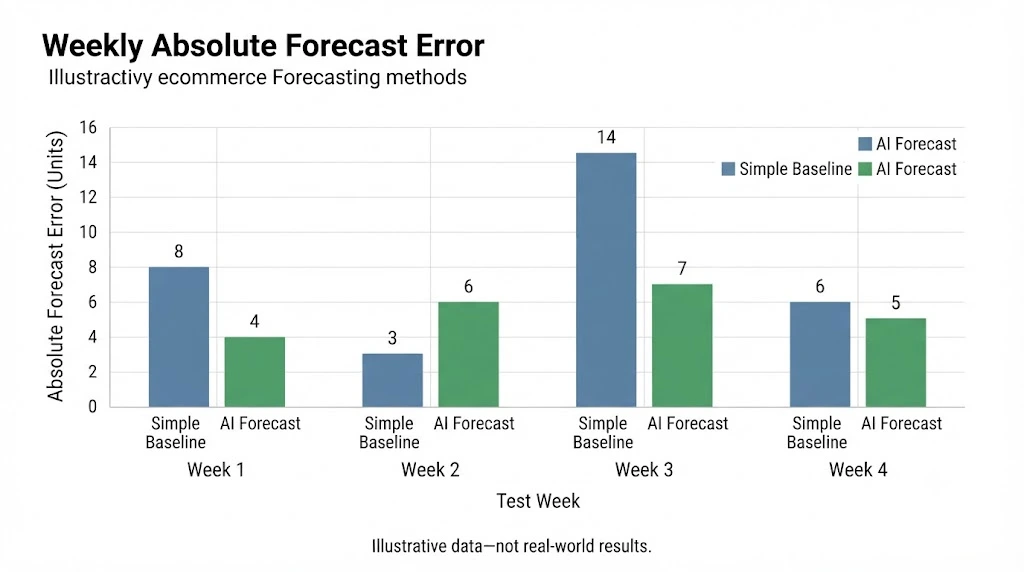
Four weeks is also a very small test. Use more weeks when you can.
When Can an Ecommerce Forecast Be Unreliable?
Every forecast has weak spots. Know them before you trust a number.
Products With Limited Sales History
A product with a few weeks of orders gives a model very little to learn from. Small swings can look like trends.
New Products With No Reliable Historical Demand
When a new product has no sales history, you can’t build a reliable time-series forecast from its own sales alone. You can start with comparable products or other available demand signals, but treat the estimate as provisional. Once actual sales come in, update the forecast and check how well it performs.
One-Off Promotions and Unusual Sales Spikes
A viral post or a flash sale can inflate your history. If those weeks aren’t flagged, the forecast treats them as normal and overshoots.
Stockouts That Hide True Demand
When a product sells out, recorded sales stop at zero even if shoppers kept coming. The data understates what people wanted.
That problem is real enough to be studied. An MIT thesis by Lila Fridley, written about Zara’s online store, looked at forecasting demand when items were out of stock. It reported that adding website data to a regression model cut prediction error by an average of 16% for items hit by stockouts, compared with traditional methods, and by about 2% across all items. You can read the full thesis in MIT’s DSpace archive (PDF).
Keep the limits in mind. Zara is a global retailer with far more data than a small store, and the result comes from one research project. It shows the stockout problem is genuine. It doesn’t tell you what you’ll gain.
A Practical 30-Day Plan to Validate Your First Forecast
Here’s a month-long plan for a first check. It tests your forecast on history you already have. It doesn’t cover buying or software setup, and a month of work can’t prove lasting accuracy.
- Week 1: Gather your sales history. Fix variant names and mark promotions, launches and unusual weeks.
- Week 2: Hold back your most recent few weeks of history. Build the baseline from the older data only, then score it against the held-back weeks.
- Week 3: Generate the AI forecast using only the older training data and any inputs that would have been available at the time of forecasting. Then compare its predictions with actual sales from the held-back weeks. Calculate MAE and WAPE using the same test period as the baseline, without using test-period actuals to fit or tune the model.
- Week 4: Compare the totals and look at the weekly error pattern. Did the AI forecast improve things by a margin that’s worth the extra effort? If not, keep the baseline.
After day 30, keep checking. Write down your forecasts for the coming weeks, then compare them with real sales as the weeks pass. That ongoing check is what tells you whether the method holds up.
Final Thoughts and Your Next Step
Good ecommerce inventory forecasting isn’t about the fanciest model. It’s about a clean sales history, an honest baseline, and a test against real sales.
Here’s something you can do today. Export eight weeks of sales for your best-selling product. Average the first four weeks and use that number as a fixed baseline forecast for each of the next four weeks. Compare the forecast with actual sales for those four weeks and calculate MAE. Then keep checking as new weeks come in.
Frequently Asked Questions
What data is needed for ecommerce inventory forecasting?
At minimum, you need product-level sales with dates. Notes on promotions, launches and out-of-stock periods make the data far more useful.
Can a small ecommerce store forecast demand without a data scientist?
Yes. A small ecommerce store can create an initial forecast with a spreadsheet and a simple moving average, without hiring a data scientist. The amount of history available affects how reliable that forecast is, and eight weeks is only a starting point (see the data section above). Compare the forecast with sales data that wasn’t used to create it.
Is AI forecasting always more accurate than a moving average?
No. A complex model can beat a simple one, but it isn’t guaranteed. The only way to know is to compare both on sales neither has seen.
How do you measure demand forecast accuracy?
Compare forecasts with actual sales from a test period. MAE shows the average miss in units, and WAPE shows total error as a percentage of total sales. Lower is better for both.
Can you forecast demand for a new product without historical sales?
Not reliably from its own sales, because there’s no history to build on. You can start with comparable products or other available demand signals, but treat the estimate as provisional. Once actual sales come in, update the forecast and check how well it performs.